
CRCT’s distributable income increases 10.5% in 3Q 2018
Underpinned by acquisitive growth from Rock Square and organic growth from multi-tenanted malls
Singapore, 30 October 2018 – CapitaLand Retail China Trust Management Limited (CRCTML), the manager of CapitaLand Retail China Trust (CRCT), announced today that it posted higher distributable income of S$23.6 million for the period from 1 July to 30 September 2018 (3Q 2018), an increase of 10.5% year-on-year from S$21.4 million in 3Q 2017. Distribution per unit for the quarter was 2.41 cents on an enlarged unit base[1]. This represented an increase of 1.7% from the DPU of 2.37 cents in 3Q 2017, or an increase of 8.6% when compared to 3Q 2017’s adjusted DPU of 2.22 cents.
In 3Q 2018, CRCT registered net property income (NPI) of S$36.7 million, 2.2% higher than 3Q 2017. The increase was driven by broad-based rental growth and effective cost management. Based on CRCT’s closing price of S$1.36 on 30 October 2018, the annualised distribution yield for the quarter was 7.0%.
Mr Tan Tze Wooi, CEO of CRCTML, said: “In the first nine months of 2018, China’s retail sales rose 9.3% year-on-year to RMB27.4 trillion, while urban disposable income and expenditure per capita grew 7.9% and 6.5% respectively. China is now growing from a larger base and its long term fundamentals remain strong. With our quality portfolio of malls offering holistic lifestyle experiences, CRCT will stand to benefit from China’s improving household income and rising consumer aspirations.”
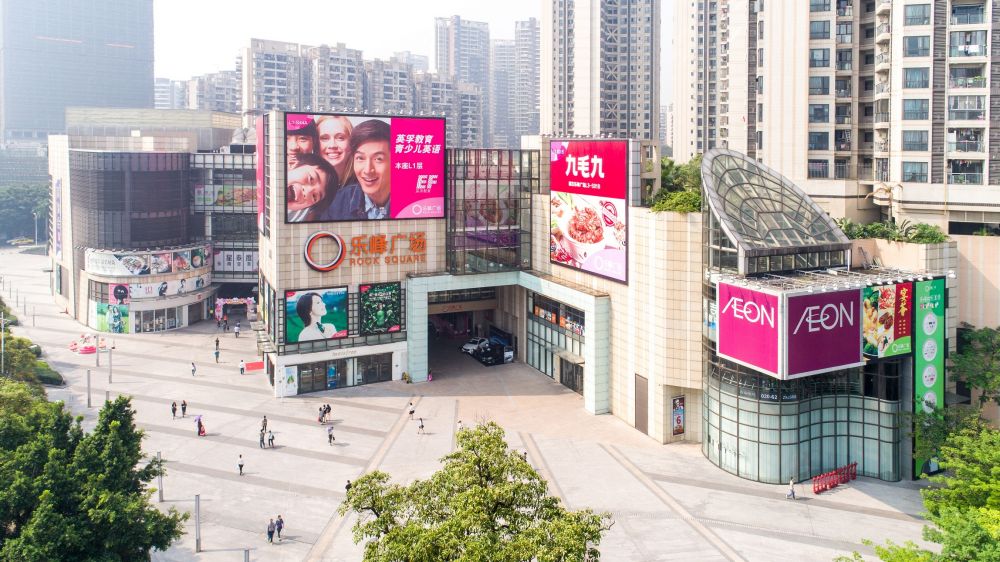
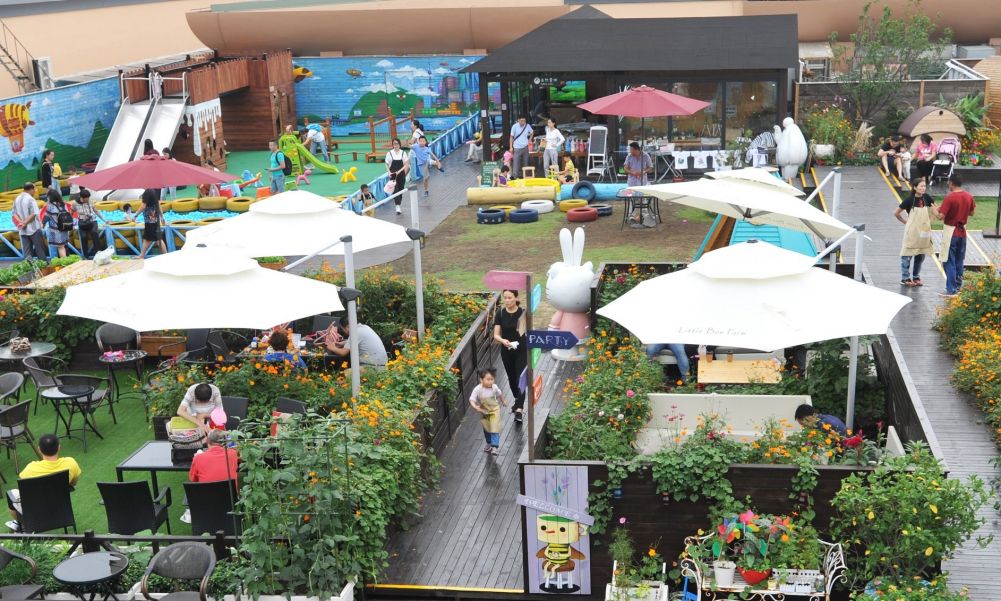
“CRCT’s growth in 3Q 2018 extends the positive momentum from our portfolio reconstitution. Portfolio occupancy as at 30 September 2018 was a healthy 97.7% and rental reversion for the quarter was a robust 12.1%. Our active asset management strategy with a tailored approach for each mall is progressing well. Rock Square registered a strong positive rental reversion above 20% for the third consecutive quarter by bringing in 25 prominent international and domestic brands, many of which are new-to-market in Haizhu District. To differentiate CapitaMall Qibao’s offerings, we increased its exposure to the resilient learning and education sector by more than three times over the last five years. We also expanded the rooftop playground to host more interactive activities that are popular with children, further enhancing CapitaMall Qibao’s attractiveness to young families.”
1 CRCT issued 64.4 million new units on 7 December 2018 under a private placement exercise to part-finance the acquisition of Rock Square.
“Through disciplined balance sheet management, we have completed all of CRCT’s refinancing requirements for 2018 and 2019 at competitive rates. About 83% of CRCT’s total debt is on fixed interest rates, providing certainty of interest expenses. To mitigate the impact of foreign currency fluctuations, as at 30 September 2018, we have hedged approximately 80% of CRCT’s distributable income into Singapore dollars. CRCT’s strong financial position will enable us to pursue acquisition opportunities to drive new growth while we continue with our active asset management strategy of extracting more value from existing properties.”
Summary of CRCT results
Periods: 1 July to 30 September (3Q) and 1 January to 30 September (YTD)
|
3Q 2018 |
3Q 2017 |
Change % |
YTD 2018 |
YTD 20171 |
Change % |
|
Actual S$’000 |
Actual S$’000 |
Actual S$’000 |
Actual S$’000 |
||
Gross Revenue2 |
55,352 |
55,989 |
(1.1) |
166,997 |
175,083 |
(4.6) |
Net Property Income2 |
36,732 |
35,951 |
2.2 |
111,545 |
116,225 |
(4.0) |
Distributable income contribution from joint venture3 |
1,847 |
- |
100.0 |
5,077 |
- |
100.0 |
Distributable amount to Unitholders |
23,647 |
21,409 |
10.5 |
76,007 |
69,101 |
10.0 |
Distribution Per Unit (DPU) (cents) |
||||||
For the period4 |
2.41 |
2.37 |
1.7 |
7.80 |
7.73 |
0.9 |
Annualised |
9.56 |
9.40 |
1.7 |
10.43 |
10.33 |
1.0 |
For Information Only
DPU (cents) (adjusted with the enlarged Units in issue)5 |
2.41 |
2.22 |
8.6 |
7.80 |
7.22 |
8.0 |
|
3Q 2018 |
3Q 2017 |
Change % |
YTD 2018 |
YTD 20171 |
Change % |
|
Actual RMB’000 |
Actual RMB’000 |
Actual RMB’000 |
Actual RMB’000 |
||
Gross Revenue |
274,013 |
274,959 |
(0.3) |
811,256 |
857,354 |
(5.4) |
Net Property Income |
181,856 |
176,570 |
3.0 |
541,878 |
569,126 |
(4.8) |
Footnotes:
1. The financial results include CapitaMall Anzhen for period from 1 January 2017 to 30 June 2017. The mall was divested since 1 July 2017.
2. Average exchange rate for SGD/RMB.
3Q 2018 |
3Q 2017 |
Change % |
YTD 2018 |
YTD 2017 |
Change % |
4.950 |
4.911 |
(0.8) |
4.858 |
4.897 |
0.8 |
3. This relates to 51% interest in Rock Square for 3Q 2018 and for period from 1 February 2018 to 30 September 2018.
4. 3Q 2018 DPU was based on 980.5 million Units. YTD 2018 DPU was based on 969.9 million Units from 1 January 2018 to 30 June 2018 and 980.5 million Units from 1 July 2018 to 30 September 2018. 3Q 2017 DPU was based on 901.8 million Units. YTD 2017 DPU was based on 888.7 million Units from 1 January 2017 to 30 June 2017 and 901.8 million Units from 1 July 2017 to 30 September 2017.
5. Adjusted DPU for 3Q 2017 of 2.22 cents was based on 966.2 million Units and YTD 2017 of 7.22 cents was based on 953.1 million Units from 1 January 2017 to 30 June 2017 and 966.2 million Units from 1 July 2017 to 30 September 2017.